Realces Radiométricos
Descripción
The maps that are obtained through digital processing of satellite imagery are useful not only for thematic mapping, but also as a backdrop on which map features can be overlaid. If the visible bands are displayed in a colour composition through the colouring of each band with the corresponding colour gun, it is important that the bands are sufficiently enhanced so that the colours appear more natural. The final display colour depends not only on the direct result of the chosen colour composition but also on the radiometric post-processing. The satellite image map will be more useful as backdrop if the bands are enhanced and displayed in colours that match the natural colours as the human eye perceives them. gvSIG provides the enhancement tools to adjust the colours for each band.
In the following sections the different parts of the dialog are described:
Histograms
The central part shows two graphs (1). The graph on the left is the histogram of the input image. The graph on the right shows the histogram of the output image. The graphs that are presented with a yellow line can be modified with the mouse. When you change the input histogram, the output histogram will be changed accordingly and you can preview the result.
In the upper corners of the input histogram are the maximum and minimum values of the raster displayed. In the lower corners, the maximum and minimum values that are being included in the enhancement are displayed. The percentage of values that are being left out of the histogram appears in parentheses. These values can be modified by grabbing and dragging the dotted vertical lines on the side of the graph. Dragging the left line will modify the minimum value, while dragging the right line will modify the maximum value. (This way, by leaving out the values that are not used in the input image, you can stretch the output values over the whole range of available values, so that the visual quality is improved.)
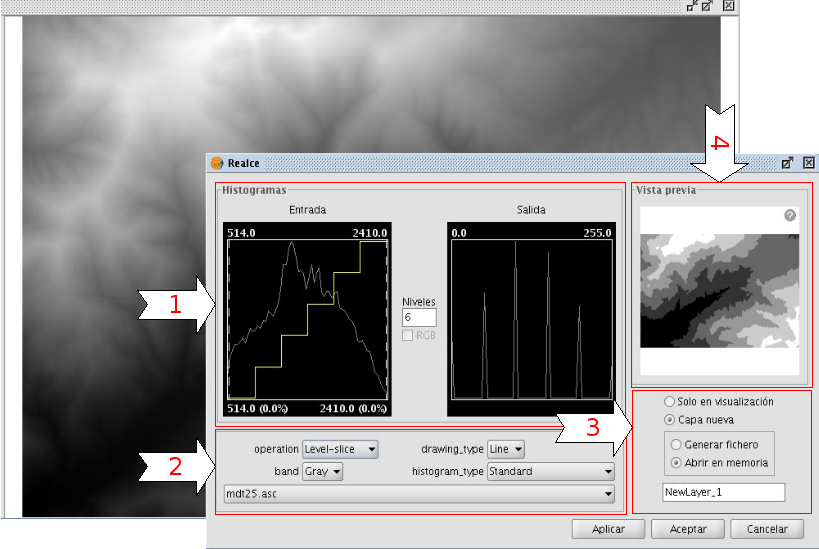
Radiometric Enhancement dialog
Controls
In the lower part of the dialog (2) you will find some controls with the following options:
Type of function:
The enhancements will replace each input value with an output value. This process is done by creating a look-up table which provides the correspondence between a range of input data and a range of output data. To apply this correspondence, a fuction is used. The used function and its parameters are chosen by the user.
Linear enhancement
- Linear: Linear enhancements apply the correspondence between the input data and output data in a linear way. In the simplest case, a straight line will correlate each value in the input interval with the corresponding value in the output interval in a complete equidistant way. For example, if you have an output range between 0 and 255 and the input values are between 0 and 1, the input value 0.5 would result in an output value of 127.5. This is the default algorithm when you first open the radiometric enhancement dialog. Variations of this algorithm can be achieved by introducing break points in the yellow line, by clicking on the line at the point where you want to break it. You can remove break points by right-clicking on them. Existing break points can be moved by dragging them. The effect is that the linear filter is divided in parts with different inclination, so that different parts will follow a different linear function as defined by the inclination of the corresponding line part.
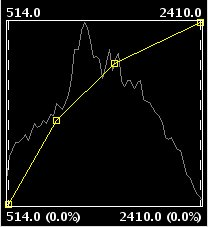
Linear radiometric enhancement
- Level slice (piecewise linear): This is a type of linear enhancement. It divides the function stepwise in equidistant parts. The effect is that the input values between two points on the same horizontal level will be assigned the same output values, so that the resulting image will have colour intervals without transitions. (This may be useful to highlight a specific range of gray levels in an image, for example to enhance certain features.) You can modify the number of intervals by changing the value in the text box labeled "Levels". The default value is 6 levels.
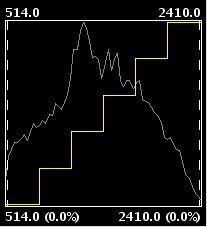
Piecewise linear enhancement
Non-linear enhancement
The non-linear enhancements have the same approach as the linear enhancements in the sense that each input value is replaced by an output value. The difference lays in the function that is assigned to produce the output values, which is non-linear. The available non-linear functions are logarithmic, exponential and square root. With each function you can modify the curve to smooth or accentuate the enhancement result.
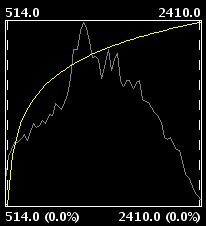
Exponential radiometric enhancement
Band
With this option you can specify the raster band to which the enhancements are applied. For a correct balance of the image, it is recommended to enhance each band separately.
Drawing type
With the option drawing type, different types of histograms can be chosen. Filled will draw a filled histogram while Line will only show the contours of the histogram. The colour of the line or fill pattern depends on the selected band. The bands Red, Green, Blue and Gray are displayed in red, green, blue and gray respectively.
Type of histogram
- Standard: Standard display of the histogram. For each possible value on the X axis, the number of pixels that are assigned this value in the output image are shown on the Y axis.
- Cumulative: For each possible pixel value on the X axis, the number of pixels that are assigned this value in the output image are shown on the Y axis. Furthermore, the number of pixels with the same or lower value are added to the result.
- Logarithmic: This shows the logarithmic value of the histogram in each position, resulting in a more balanced histogram without dominating peak values.
- Cumulative Logarithmic: This shows a cumulative histogram in logarithmic values.
RGB Check box
When check box labelled as RGB is ticked, it is assumed that the image is displayed as RGB with Byte data type and values between 0 and 255. If the checkbox is not ticked, it is assumed that the range of values are Byte data type values between -127 and 128, which will produce significant differences in the display and in the minimum and maximum values that are shown in the bottom of the input graph.
Display enhancement results
In the lower right part of the dialog (3), you can indicate how you want to see the enhancement results; in the current view or saved as a new layer.
Preview
The preview window (4) shows the real-time results of each enhancement that is applied to the image.
